| Tech Tip # 3 How do Distortion Analysis Techniques Compare? |
Distortion
measurements for audio signals can be made using conventional analog analysis
techniques or by converting the signal into its digital representation
by means of a precision ADC, then applying DSP analysis techniques.
The Audio Precision System Two Cascade Plus can operate in both the analog
and digital domains to make distortion measurements using both analog
and digital techniques. The results of these two methods are slightly
different, with the DSP technique sometimes reporting more distortion
and noise, sometime less. Why is this?
There are several reasons, all related to subtle differences in the methods
applied. Let's look closely at what's going on.
Conventional
THD+N Measurement
For clarity we will look at distortion analysis with only one
stimulus tone, although in practice swept tones (using analog analysis)
or multiple tones (using DSP analysis) can also be used.
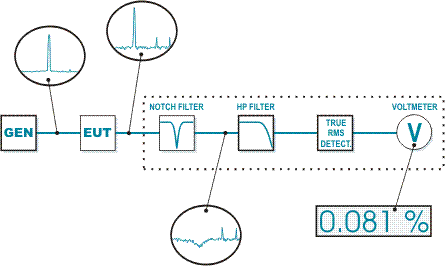
Conventional THD+N methods apply a very pure (very low distortion) sine
wave to the input of the EUT at the frequency and level of interest.
In the analyzer, this fundamental is first removed from the output of the EUT by means of a very narrow, very deep notch filter tuned to the stimulus frequency. Then the signal is usually band-limited to reject out-of-band signals. For typical audio applications we recommend the 22 kHz low-pass filter as a minimum. Option filters, if used, are applied next. After this filtering the remaining signal is measured with a root-mean-square (rms) voltmeter. The result is expressed as a ratio to the amplitude of the fundamental, in decibels or in percent.
DSP
THD+N Measurement
In this example we will consider the EUT to be an analog device,
stimulated with a pure tone as in the previous measurement.
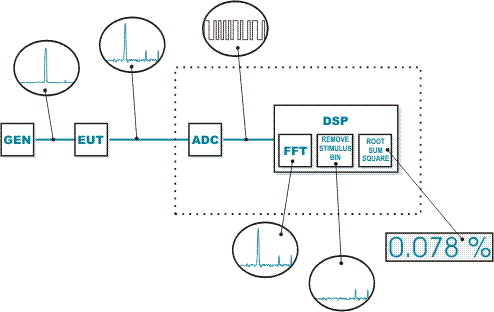
For DSP analysis, the signal from the EUT is first sampled by a precision ADC (analog to digital converter) and brought into the digital domain. Both the sampling rate and the resolution (word length) of this conversion can have an effect on the distortion analysis. For typical THD+N tests, System Two's 20-bit ADC is set to a sampling rate of 48 kHz.
The converted signal is analyzed mathematically using the fast Fourier transform (FFT) technique. FFT analysis by its nature effectively band-limits the signal without applying a physical filter-the signal acquired will extend in frequency only to the Nyquist frequency (one-half the sampling frequency). This band-limiting acts like a very steep "brick wall" filter at the Nyquist frequency. The low-frequency end of the spectrum, however, is unlimited-flat right to DC (within the performance limits of the analog input circuitry, of course).
In FFT analysis the spectrum is divided into bins, all of equal frequency width. The number of bins is equal to one-half the number of samples acquired in the record. The width of the each bin is equal to the Nyquist frequency divided by the number of bins. When using PC Audio Tests (System Two sample rate set at 48 kHz, number of samples 8192), the bin width is 5.86 Hz.
For an FFT THD+N measurement, the bin centered on the stimulus frequency is removed from consideration, a process analogous to using a notch filter. The remaining signal is measured by performing a root-sum-square (rss) computation on the data, and a THD+N measurement results.
Different
Questions Produce Different Answers
As
you can see, the two methods are similar but not exactly the same. Most
of the differences in measurements result from the different shapes of
the response curves of the physical filters in the analog analyzer and
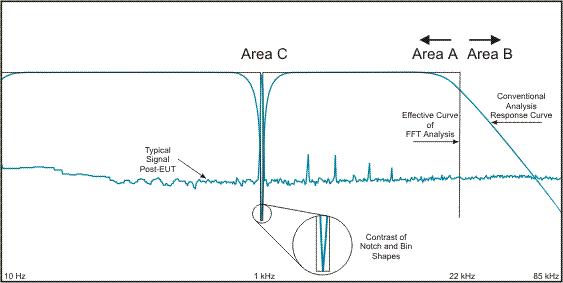
the effective filtering in DSP. Look at these curves, with the analog
THD+N filter response overlaid on the effective FFT response:
At the high end of the spectrum the two filter slopes cross. Below the crossing (Area A) the analog filter offers more attenuation; above the crossing (Area B) no signal at all is being measured by the DSP technique. The analog filter, however, can pass signal (reduced, but still measurable) up to 80 kHz and above. If the signal has a great deal of energy in the range above 20 kHz, the analog analyzer will return a higher THD+N reading.
Near the
stimulus frequency a similar phenomenon takes place at Area C. The broader
shoulders and steep but finite slope of the analog notch offer more rejection
around the stimulus than the extremely narrow FFT bin with its vertical
sides. However, as the magnifying circle at the bottom of the illustration
shows, the analog notch, at its extreme, is even narrower than the 5.86
Hz-wide FFT bin.
It may be hard to imagine such a small difference having much meaningful
effect, but modulation noise can have strong components near the modulating
tone. Depending on the distance of the sidebands from the fundamental,
in some cases the analog notch technique may read more THD+N while in
other situations the FFT technique will measure more.
Another source of difference between analog and DSP THD+N analysis can
be traced to the ADC used in converting the analog signal into the digital
domain for measurement. At low input levels near the limit of the resolution
of the ADC, quantization error will add distortion (or noise, if the signal
is dithered) and increase the THD+N measured by the DSP technique.
However,
since the PC sound card analog output signals measured in PC Audio Tests
are the result of 16-bit digital-to-analog conversion in the sound card,
the noise in the signal will always be above the distortion and noise
floor of the higher-resolution 20-bit ADC used in System Two for DSP analysis
of analog signals. In this case the DSP conversion for analysis can be
considered entirely transparent.
What's the final result of all of this? The numbers you get from applying
these two THD+N methods will always be slightly different, depending on
the characteristics of the signals being measured. Each set of results
is accurate, though, and each represents a valid means of measuring the
signal.


